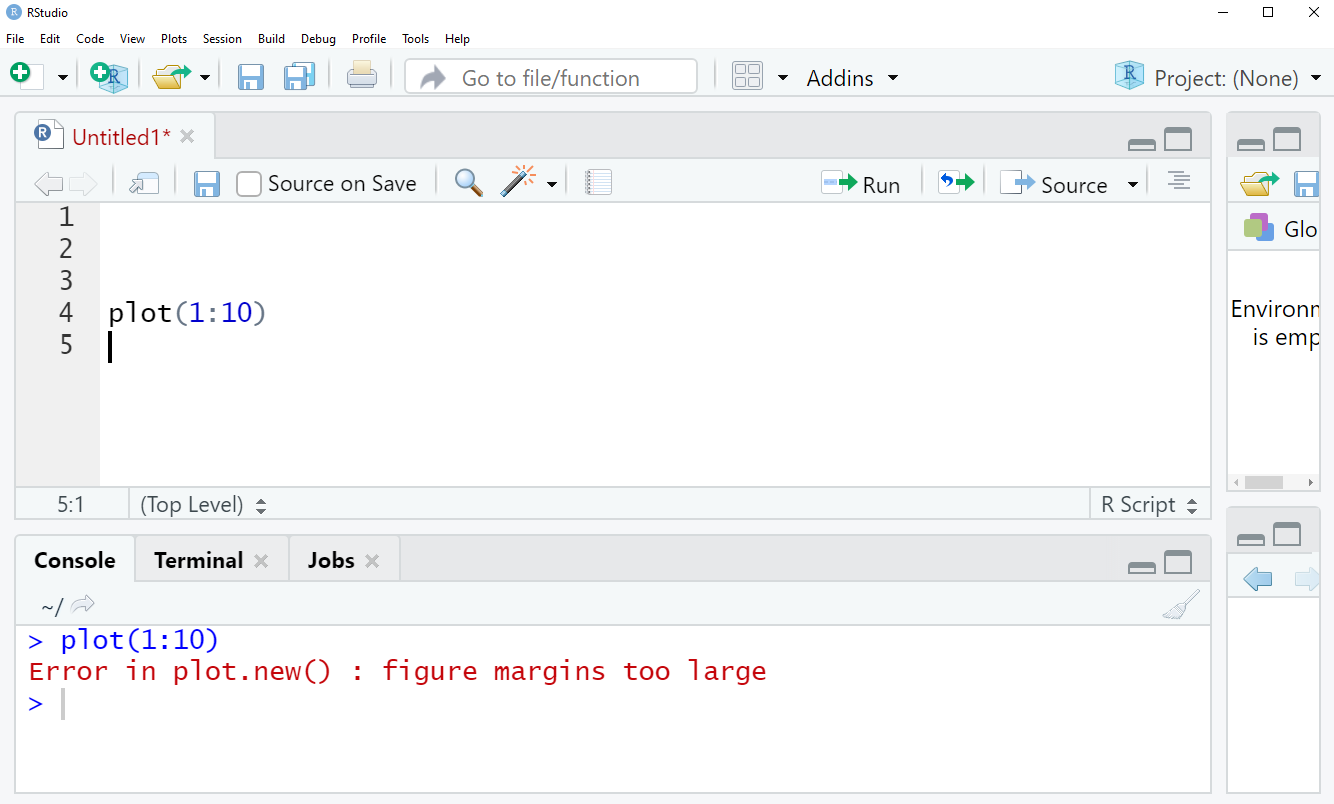
Have you ever tried to create a plot, only to be stopped by the frustrating message: “Error in plot.new figure margins too large”? If you’re working with R or other plotting tools, this error can feel like a roadblock that halts your progress and leaves you confused.
But don’t worry—this issue is more common than you think, and fixing it is easier than it seems. You’ll discover simple, clear solutions that will get your plots back on track quickly. Keep reading, and say goodbye to those annoying margin errors for good!
Cause Of Margins Too Large Error
The Margins Too Large error appears when the plot area is smaller than the margins set around it. This often happens in R programming or similar tools when the plot window size is too small. The margins are the space around the plot for titles, labels, and axes. If these margins take up too much space, the plot cannot fit properly, causing the error.
Common causes include:
- Small plotting window or device size.
- Excessively large margin settings in the code.
- Multiple plots drawn in the same window without adjusting margins.
Adjusting the plot window size or reducing margin values can help fix this. Also, resetting the graphics device or using layout functions properly avoids this error.
Adjusting Plot Window Size
Sometimes, the plot window is too small for the figure. This causes the error “Plot New Figure Margins Too Large”. To fix this, try making the plot window bigger. Drag the window edges to increase its size.
Another way is to set the plot size in your code. Use commands to adjust the figure size before plotting. This gives more space for your plot and stops the error.
Remember to check the margins too. Smaller margins need less space. Changing margins can help fit the plot inside the window.
Modifying Plot Parameters
The “margins too large” error happens when the plot size is bigger than the space available. Adjusting plot parameters can fix this problem. Try changing the margin sizes using the par(mar = c(bottom, left, top, right)) function. Smaller numbers make the margins thinner and fit the plot better.
Another way is to set the layout or figure size. Use par(mfrow = c(rows, cols)) to arrange multiple plots in a grid. This helps control space and avoid overlap.
Increasing the plotting window or saving the plot as a bigger image can also help. Use png() or pdf() with bigger width and height values.
| Function | Use | Example |
|---|---|---|
| par(mar) | Change plot margins | par(mar = c(5, 4, 4, 2)) |
| par(mfrow) | Set multiple plots layout | par(mfrow = c(2, 1)) |
| png() | Save plot as image | png(“plot.png”, width=800, height=600) |

Credit: stackoverflow.com
Using External Plot Devices
Using external plot devices can help avoid the “plot new figure margins too large” error. These devices create plots outside the main window. It frees up space for your graphs. This method works well for large or multiple plots.
Common external devices include PDF, PNG, and JPEG files. Save your plot directly to one of these formats. This way, the plot size does not depend on the screen or window size.
| Device | Description | Use Case |
|---|---|---|
| pdf() | Saves plot as a PDF file. | High quality, good for printing. |
| png() | Saves plot as a PNG image. | Good for web and screen display. |
| jpeg() | Saves plot as a JPEG image. | Suitable for photos and color images. |
Start the device before plotting. Use dev.off() to close it after. This process helps manage plot size and avoids margin errors.
Preventing Future Margin Errors
Set the figure margins carefully before creating a plot. Use the par(mar) function to adjust margins in R. Smaller margins help avoid the “figure margins too large” error. Check the current margin sizes with par("mar") and reduce values if needed.
Avoid using very large plots in small windows. Resize the plot window or use dev.new() to open a bigger one. This gives more space for the plot and margins.
Clear old plots with dev.off() before starting a new plot. It frees up space and avoids overlapping issues.
| Tip | How to Apply |
|---|---|
| Adjust Margins | Use par(mar = c(5, 4, 4, 2)) with smaller values |
| Resize Plot Window | Drag window edges or use dev.new(width=7, height=7) |
| Clear Previous Plots | Run dev.off() before plotting again |

Credit: stackoverflow.com
Credit: statisticsglobe.com
Frequently Asked Questions
Why Does The ‘margins Too Large’ Error Appear In Plots?
This error shows when the plot area is smaller than the margins set. It blocks the plot from showing.
How Can I Fix The ‘margins Too Large’ Error In R?
Try reducing plot margins with par(mar=. . . ) or increase the plotting window size before plotting.
Can Adjusting The Plot Window Size Solve Margin Errors?
Yes. Making the plot window bigger often removes the ‘Margins Too Large’ error immediately.
Does Resetting Graphical Parameters Help With This Error?
Resetting parameters using dev. off() clears old settings and can fix margin-related plotting errors.
Conclusion
Fixing the “Plot New Figure Margins Too Large” error is simple. Adjust your plot window size or margins carefully. Small changes can make your graphs appear correctly. Keep practicing with different settings to find what works best. This error won’t stop your progress if you stay patient.
Clear plots help you understand data better and share results easily. Stay consistent and don’t get discouraged by small technical issues. Your coding skills will improve step by step. Keep exploring and enjoy creating clean, clear plots every time.